Overview
What the study found
TL;DR: 132 annotators made 26,780 head-to-head judgments between AI-generated answers to health questions, each time choosing which answer they preferred. When analyzing the characteristics of each answer choice, it seemed as if things like whether a model explained its reasoning, the structure in which the answer was written, etc, influenced which answer people preferred, but in reality it was tied to which model generated the answer. Once we controlled for that variable, those effects disappeared.
Length was the exception. Longer answers were still more likely to win.
The bigger point is that some things we think we're measuring in an AI eval may actually just be model-specific writing habits. Our data keeps the individual comparisons behind the aggregate result, which enables us to see these patterns instead of treating the original findings as fact. When others set up their own evals, these nuances get lost and collapsed into a single leaderboard score.
What we thought we’d found
We analyzed 26,780 quality-filtered preference judgments from 132 raters, covering 4,272 distinct pairings of 2,848 answers to 712 consumer-health questions. Each question was answered by four anonymous frontier models, and all answer pairings received at least 5 judgments.Initial pooled analyses suggested that several answer features, including structure, explanations, urgency guidance, and length, were associated with preference. However, we noticed many of these features were also stable habits of particular models.
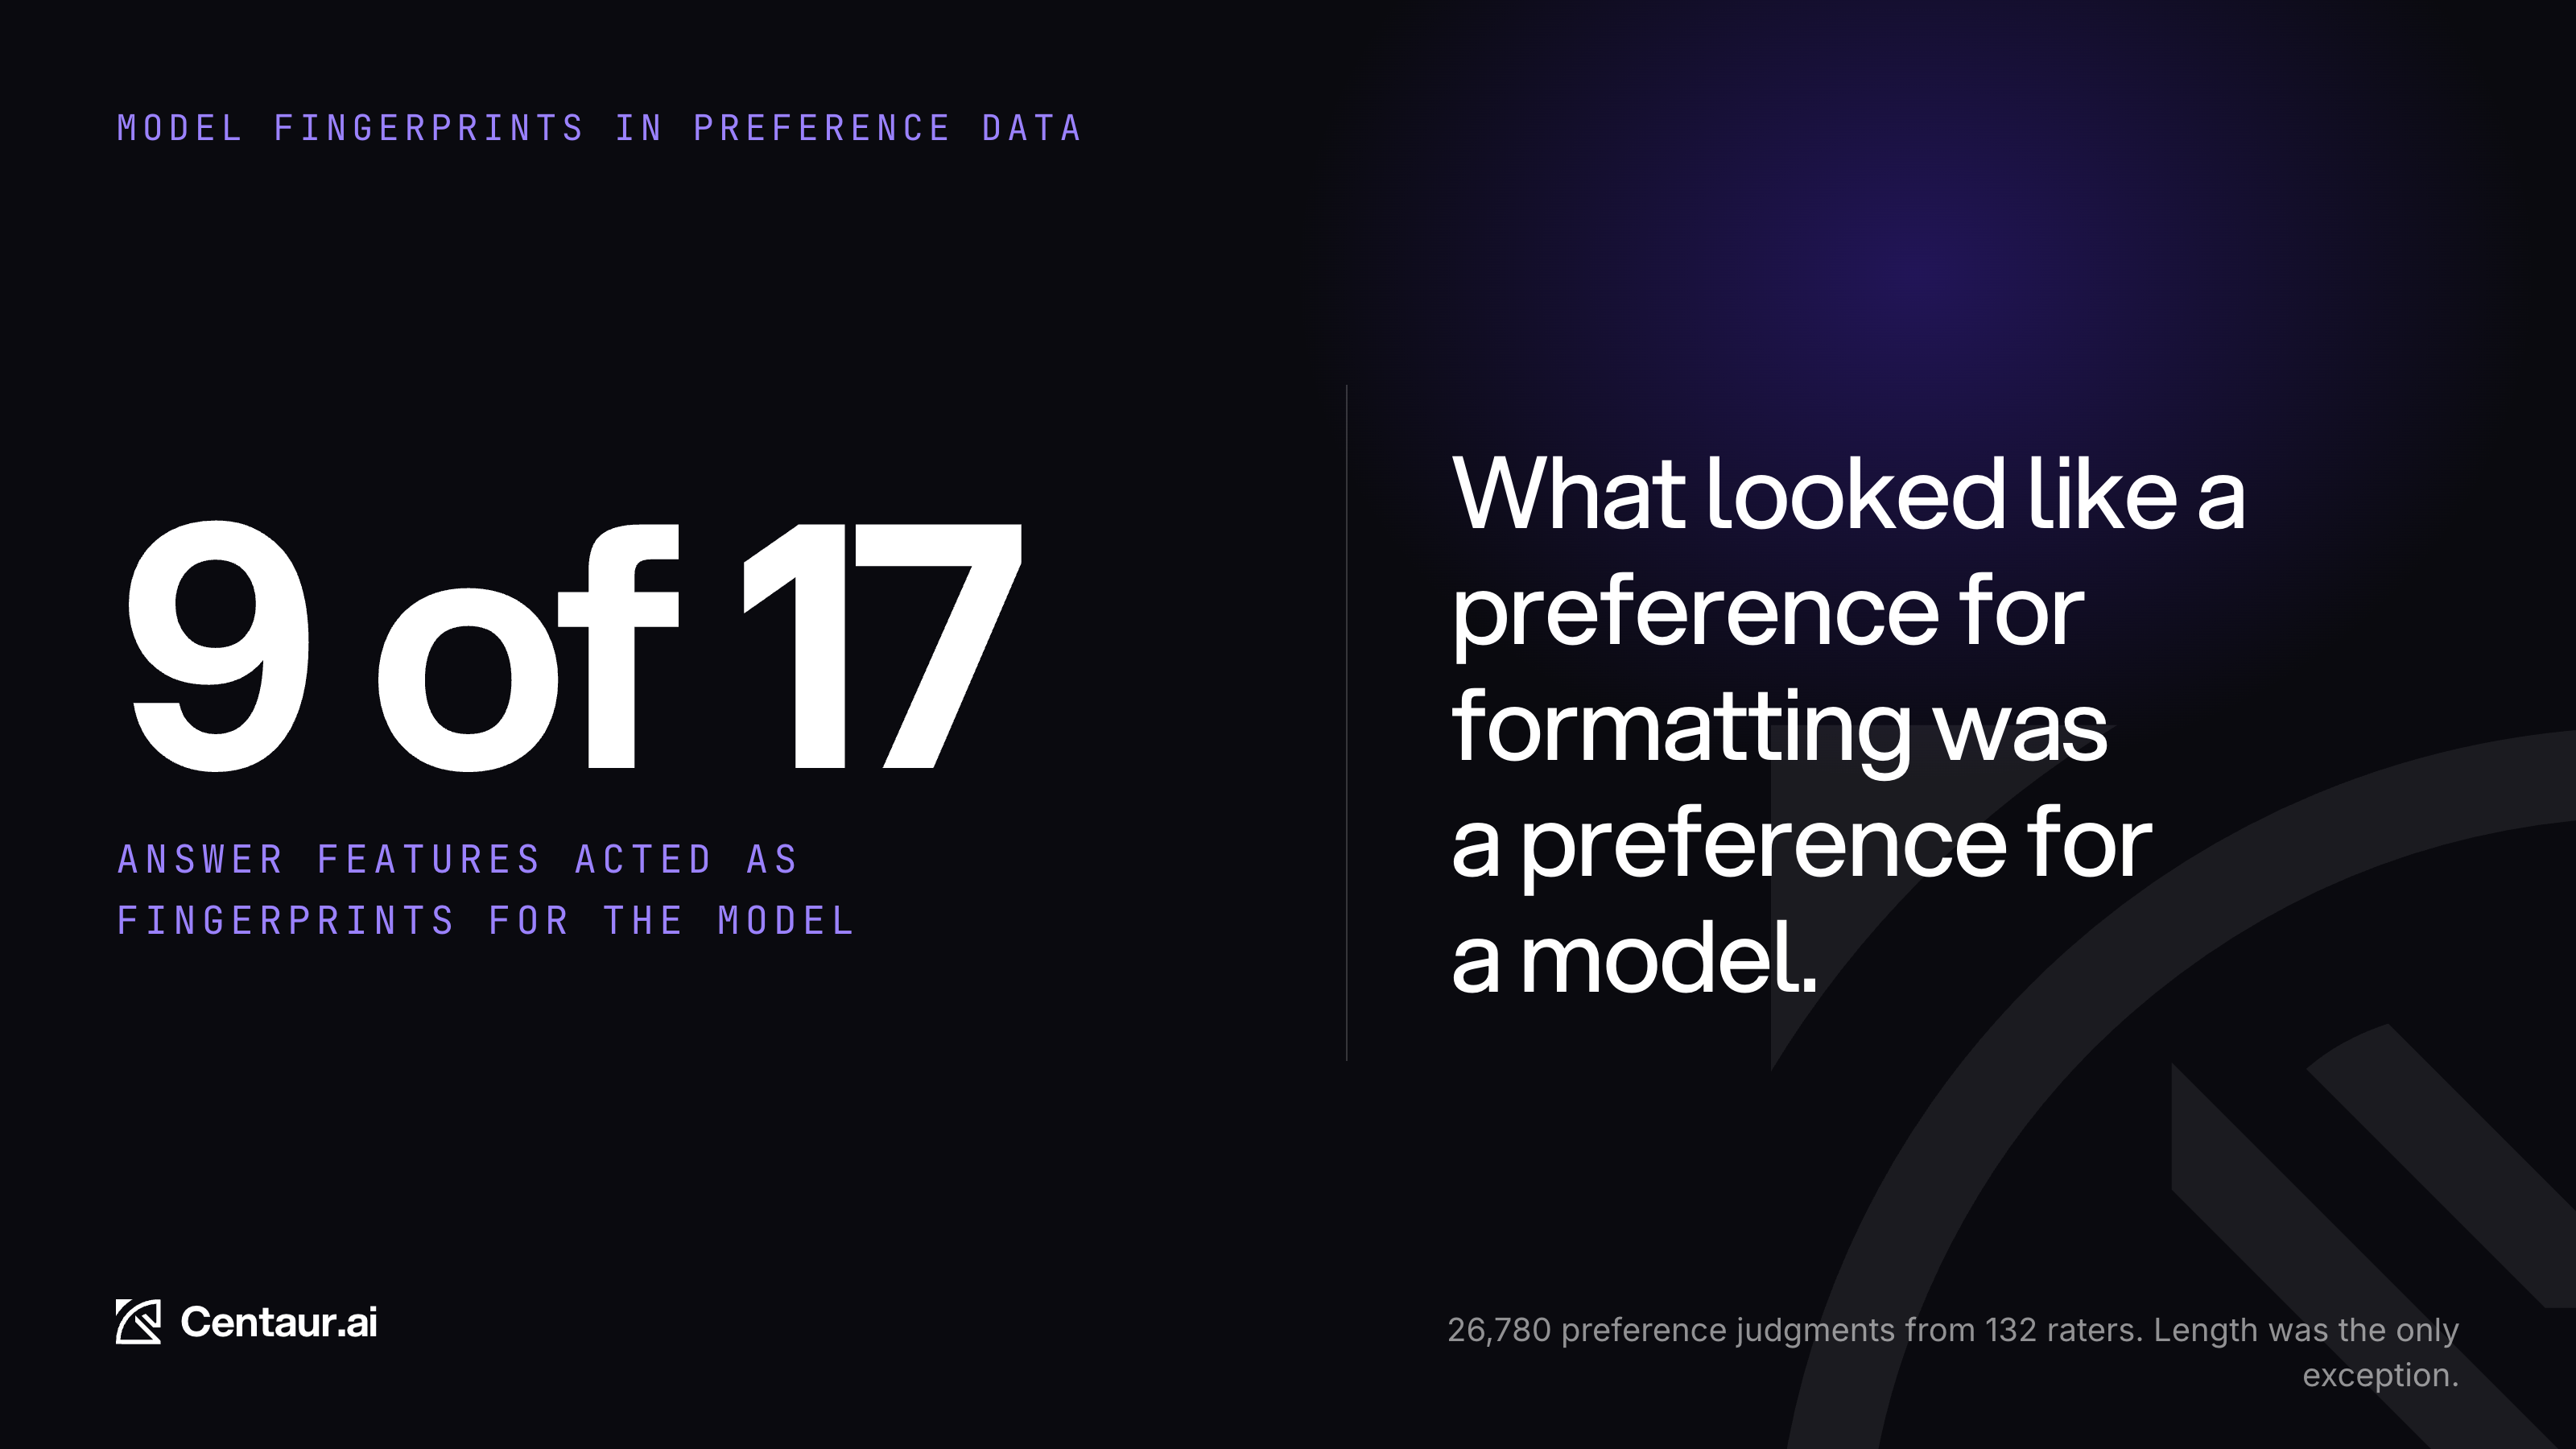
To quantify this, we calculated a signature ratio that compared differences between model averages with variation among answers from the same model. Nine of the 17 features exceeded the approximate threshold of 0.8, meaning their values differed substantially across models relative to how much they varied within each model. In other words, more than half of the apparent feature findings also acted as “fingerprints” for which model wrote the answer. Section headers had a ratio of 1.85, so the differences between models were nearly twice as large as the variation within them. At the other end, how densely an answer uses numbers came in at 0.25, so the differences vary mostly from answer to answer, not from model to model.
Controlling for model identity
We tested whether these associations survived when the model pair was held fixed. The four models created six possible pairings, and within each pairing we treated either model as the focal model. We then compared its win rate when its own answer contained a feature with its win rate when the feature was absent. Length needed separate handling since it varies widely inside every model, and it is also the only feature that ultimately survived, so we held it roughly constant while testing the others.
These tests used 951 comparisons in which the two answers differed in length by no more than 40 percent. Together with the pair restriction, this kept both the model matchup and answer length roughly comparable. The design created 204 possible tests, but only 48 had at least 20 comparisons on both sides of the feature split. That minimum prevented us from drawing conclusions from features that appeared only a handful of times. But the pattern in which combinations dropped out is itself telling: the features most entangled with model identity were the least testable. Section headers yielded one usable test out of twelve; number density, the least model-specific feature we measured, yielded six.
None of the 48 tests produced a statistically distinguishable preference difference. We used a deliberately strict bar (the two win rates had to have non-overlapping confidence intervals) and checked by simulation how often chance alone clears it: well under once across all 48 tests. So zero is what an absence of large effects looks like, though effects too small for this test to detect would look the same.
That length restriction is doing real work. Drop it and the same method yields 129 tests, of which five separate, more than chance produces. But every one of the five involves a formatting feature that travels with answer length, which is exactly what the restriction is there to prevent.
We also re-ran the analysis with model identity included as a variable, which shows how large the original confound could be. The estimated association between preference and the breadth of possible causes mentioned in an answer changed from −0.099 with p = 9 × 10⁻¹¹ to +0.002 with p = 0.9 after model identity was included. The first result looked overwhelmingly convincing. The second was effectively flat: once the model was accounted for, the data provided no evidence that mentioning more causes changed preference.
Why answer length was different
The ratio is a warning, not a verdict. Word count had the third-highest signature ratio, yet length remained associated with preference in a separate full model that included identity throughout. It was the only measured feature to remain significant, with an estimated association of +0.459 per standard deviation and p = 8.8 × 10⁻⁵. This means that a typical increase in answer length was still associated with higher modeled preference after accounting for which model wrote the answer, and the result would be unusual under a model with no length association.
Length accounted for roughly 39 percent of the leading model’s advantage. Put another way, about two-fifths of its lead was associated with answer length, while the remaining three-fifths was not explained by any of the other measured features. Length may still be standing in for an unmeasured property that raters actually preferred, so this remains an observational finding rather than a causal one.
What the analysis can and cannot show
The fixed-pair estimates had uncertainty ranges of roughly ±3 to ±10 percentage points. That gives the tests enough precision to reject many of the large effects suggested by the pooled analysis, but a real two- or three-point effect could still be too small to detect. These findings therefore do not show that formatting, explanations, or urgency guidance have no effect. They show that none of those measured features survived the test designed to separate them from model identity.
Why we could see it
Centaur collects multiple independent opinions on each comparison and preserves the disagreement between them when producing the aggregate result. This allows a finding to be traced back to the model pairings and judgments that produced it. In this study, that made it possible to separate apparent feature preferences from model identity and retire conclusions that did not survive the control.
Most leaderboards end at the ranking. Keeping the underlying judgment history and aggregation process available for audit means the analysis can be reopened when a plausible alternative explanation appears. Here, several findings that looked strong enough to shape a scoring rubric or reward signal turned out to be model signatures. A reliable evaluation should report who won while remaining equally clear about what the available evidence can and cannot explain.