Overview
The Limits of Preference 03
Health evaluation rubrics often score LLM responses across dimensions such as clarity, empathy, actionability, medical accuracy, and safety. Those ratings tell us how a response performs on each quality. They do not automatically tell us which response someone would rather receive.
For this analysis, we tested that relationship directly. We took 80 LLM responses to consumer health queries and created edited versions that reduced either empathy or clarity while changing as little else as possible. We then measured how much the target rating changed and how often the edited response was still preferred over its unchanged original.
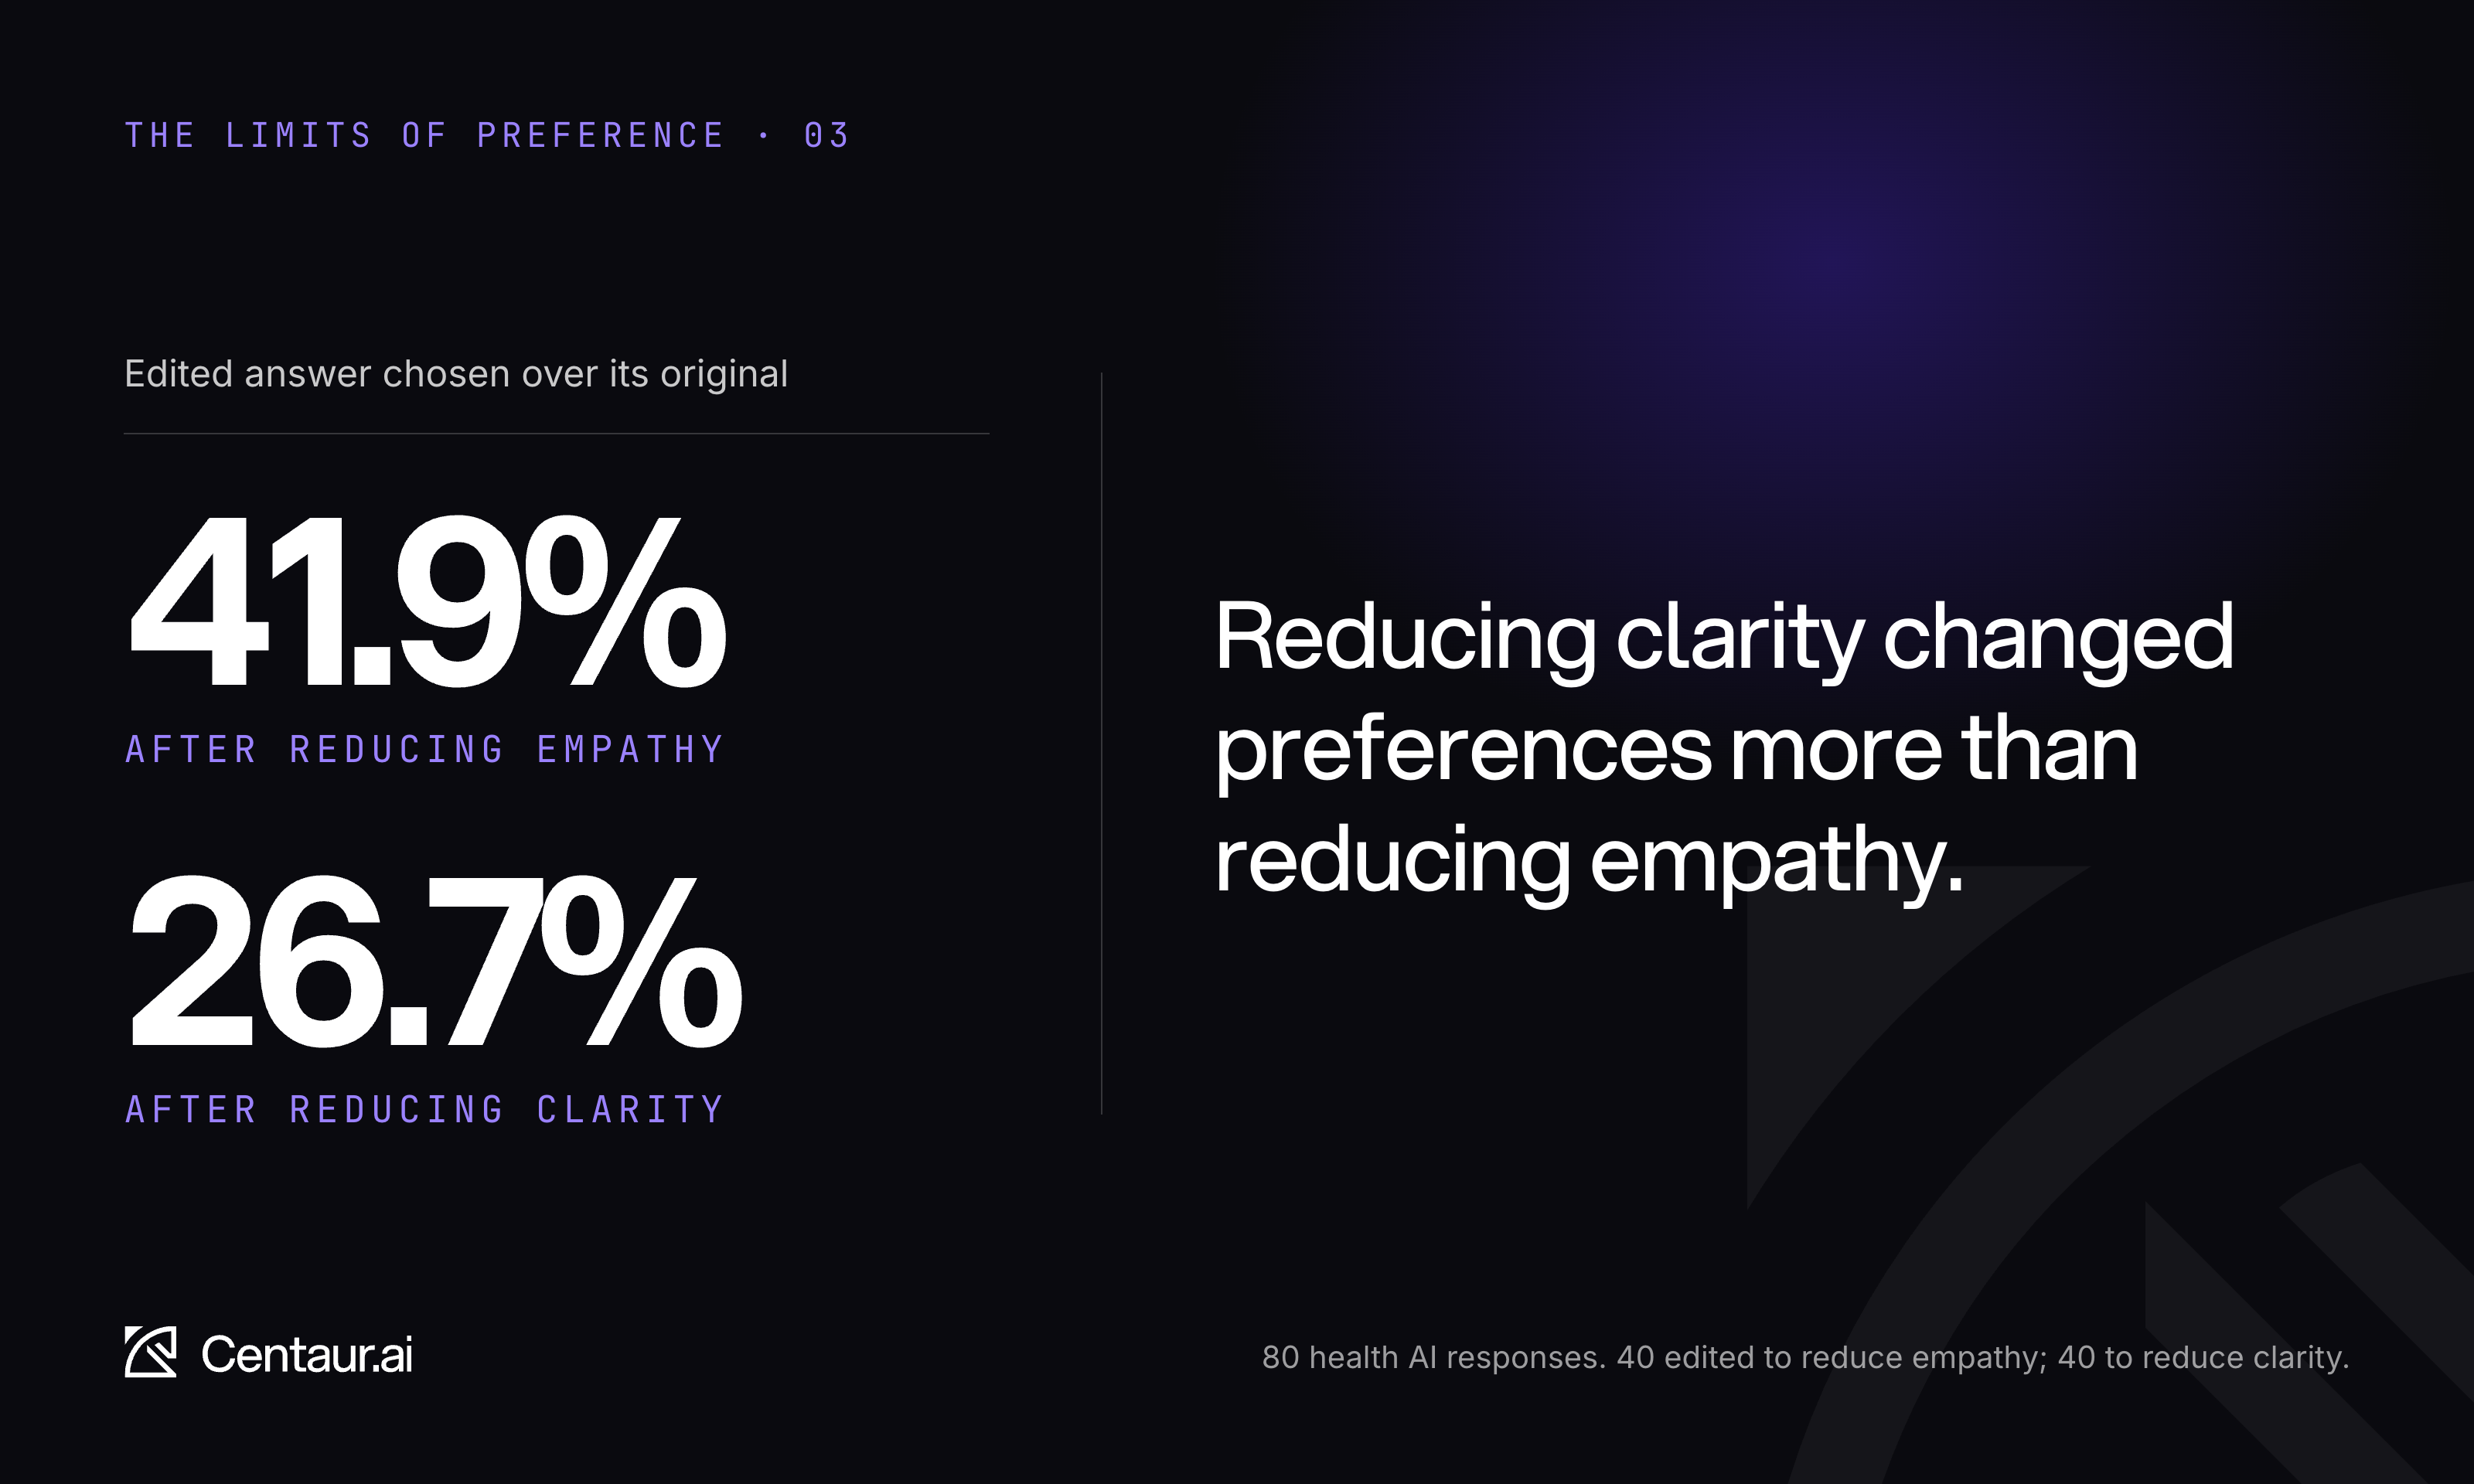
The edits produced comparable changes in their target ratings. Annotators still preferred the empathy-reduced response 41.9 percent of the time, compared with 26.7 percent for the clarity-reduced response.
This extends the first two posts in our Limits of Preference series. Post 01 showed that response features associated with preference can also reflect systematic differences between models. Post 02 showed that preference can miss what matters clinically: in a controlled experiment, people rejected dismissive answers more often than answers containing factual errors.
Here we ask another question. When one quality of a response gets worse, how much does that change which response people prefer, and does the answer depend on which quality it is?
Study design
Comparing two naturally occurring responses is not enough to isolate a quality such as clarity. The responses can also differ in length, structure, tone, content, and which model produced them. If one is preferred more often, clarity may not be the reason.
We instead compared each edited response with its own original. The health prompt and model stayed the same, and the rest of the response was kept as stable as possible.
Forty responses were edited to reduce empathy and forty to reduce clarity. About 12 annotators rated each response on the two dimensions. About six additional annotators compared each edited response with its original and selected the one they would rather receive without being told which had been changed.
The dimension ratings tell us whether the intervention changed empathy or clarity. The head-to-head comparison tells us how that change affected preference.
Effects of the interventions
Empathy and clarity have different score distributions, so raw rating changes are not directly comparable. We therefore express the effects as percentile movements within the corpus.
The ranges shown in brackets are 95 percent confidence intervals. They represent the uncertainty around each estimate.
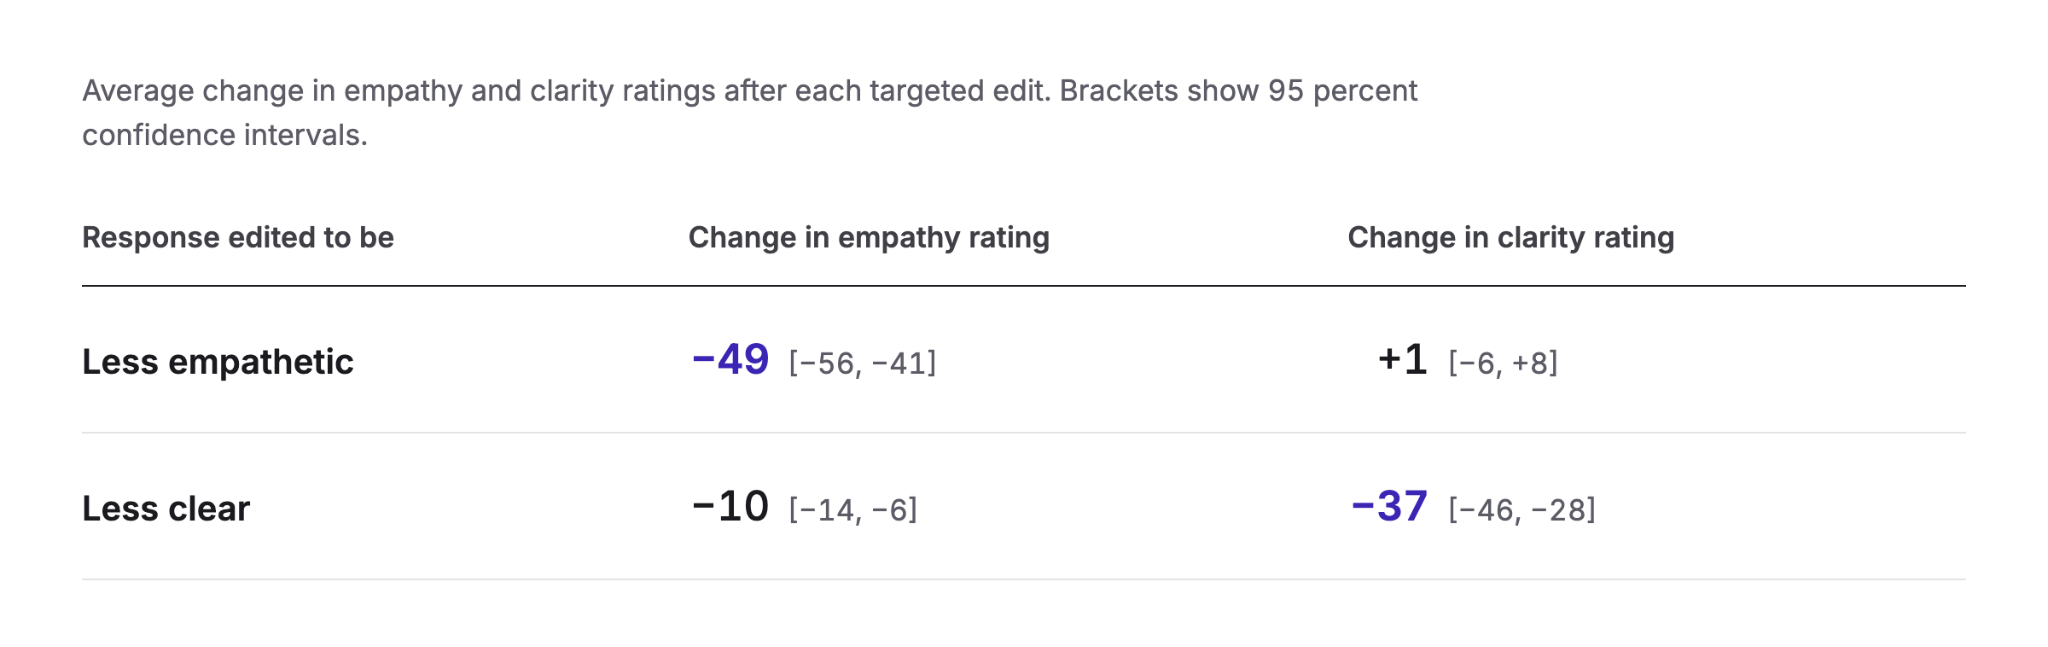
Comparable changes in empathy and clarity ratings
The empathy intervention reduced empathy by about 49 percentile points, with a 95 percent confidence interval of [−56, −41]. It left clarity essentially unchanged at +1 percentile point [−6, +8].
The clarity intervention reduced clarity by about 37 percentile points [−46, −28]. It also reduced empathy by about 10 percentile points [−14, −6].
The two edits moved their target ratings by similar amounts, 49 and 37 percentile points. If anything the empathy edit was the larger of the two, which makes the difference in preference that follows harder, not easier, to explain by the size of the edit.
Effects on preference
We then measured how often the edited response was still selected over its unchanged original. If an edit had no effect on preference, we would expect the edited response to win about half of the comparisons.
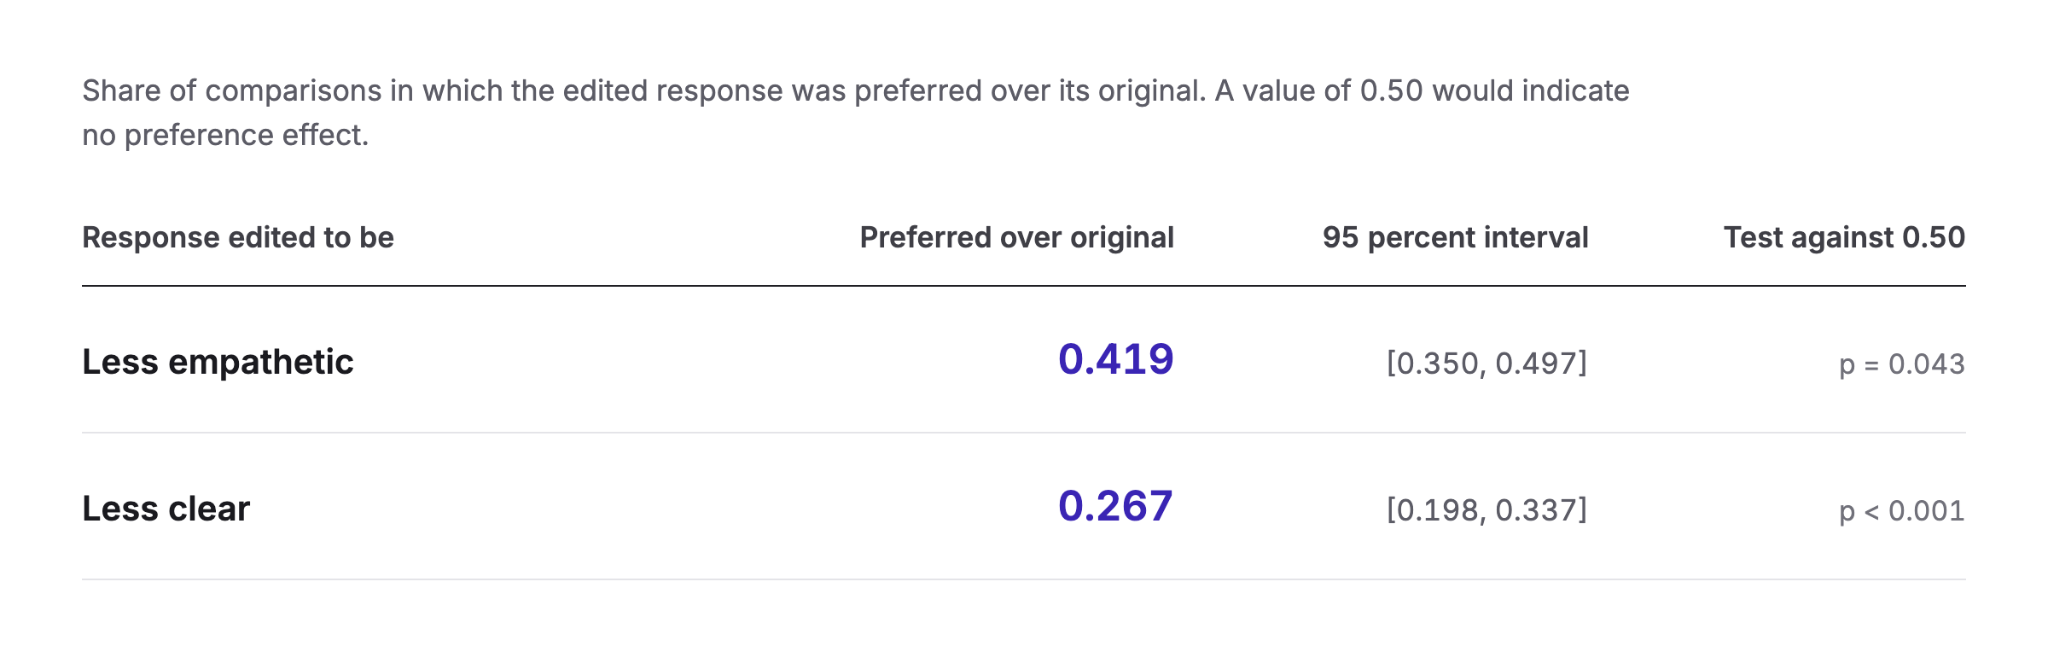
How often the edited response was still preferred
After empathy was reduced, the edited response was still preferred 41.9 percent of the time [35.0, 49.7].
After clarity was reduced, it was preferred 26.7 percent of the time [19.8, 33.7].
The difference between those effects was 15.3 percentage points, with a 95 percent confidence interval of [5.8, 25.3]. Because that interval does not include zero, the analysis supports a difference between the two interventions.
This does not mean empathy has no effect on preference. Its effect was smaller and close to the 50 percent no-effect threshold. The narrower finding is that comparable movements in two quality ratings did not produce comparable movements in preference.
Three ways to measure the effect of clarity
Clarity also lets us examine the same relationship under three different analysis designs.
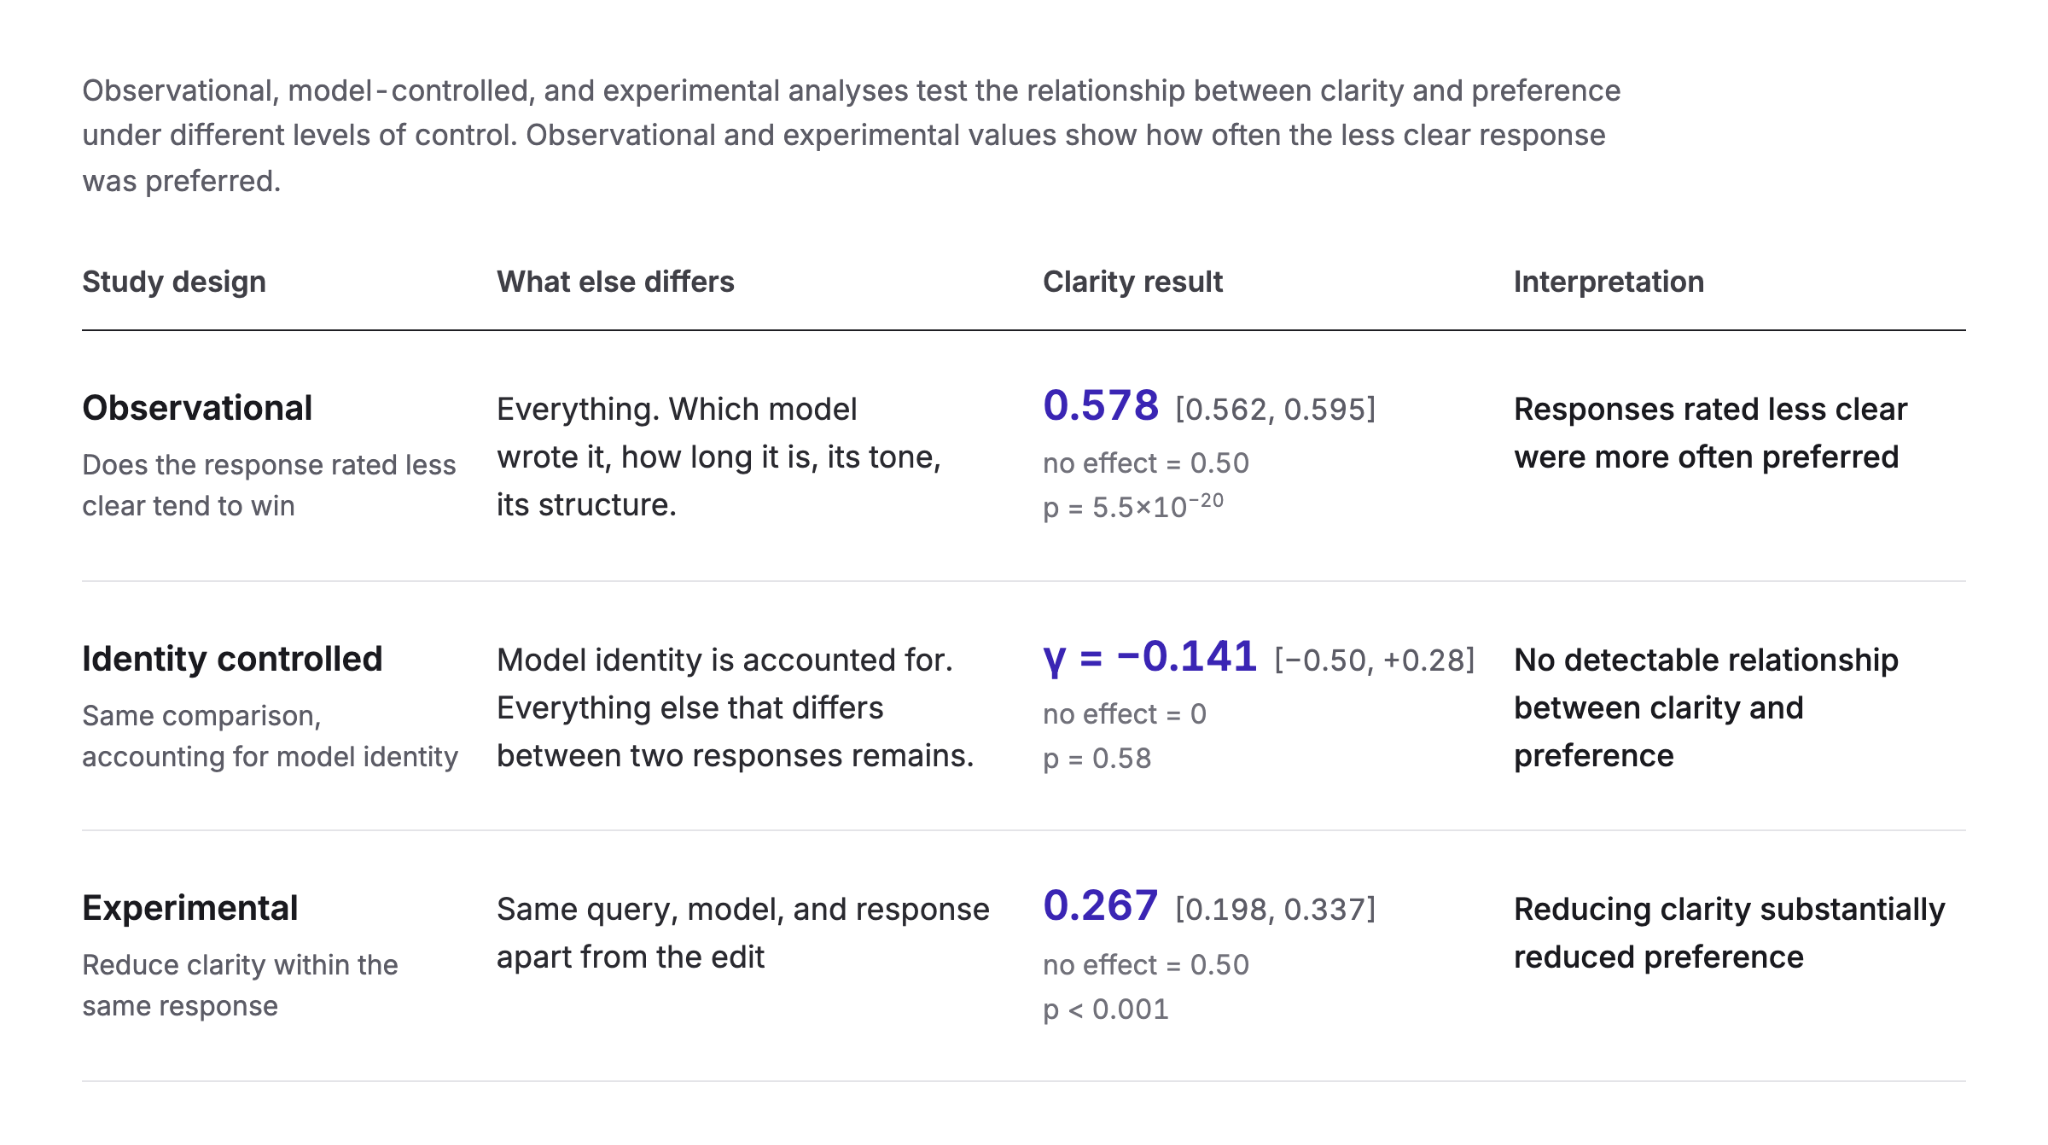
Clarity across three analysis designs
In the pooled observational analysis, the less clear response was preferred 57.8 percent of the time [56.2, 59.5]. Taken alone, that association suggests that responses with lower clarity ratings were more likely to be preferred.
But many other properties of those responses vary at the same time.
We therefore repeated the analysis while accounting for which model produced each response. The estimated clarity coefficient was −0.109, with a 95 percent confidence interval of [−0.50, +0.28]. Because the interval includes zero, this analysis does not provide evidence that clarity independently predicted preference after accounting for model identity.
The intervention asks a different question. We deliberately reduced clarity within the same response while keeping the query, model, and surrounding response as stable as possible.
Under that design, the clarity-reduced response was preferred only 26.7 percent of the time [19.8, 33.7].
These estimates are not all on the same statistical scale. The observational and experimental results are both the share of comparisons won by the less clear response measured against 50 percent. The identity-controlled estimate is a model coefficient measured against zero.
Limitations
The original responses scored relatively high within the corpus, so these results describe what happens when relatively strong responses are made worse. They do not establish the same relationship for responses that already score poorly.
The empathy edit's effect on preference was small and only just distinguishable from no effect, so its exact size is uncertain.
We also tested actionability, but it was not included in this comparison. In health responses, the recommended next step can also carry important safety guidance, such as whether someone should seek care urgently. Before collecting any judgments, we required the actionability edits to preserve that urgency. As a result, those edits reduced actionability by only about 8 percentile points, compared with 49 for empathy and 37 for clarity, making the intervention too small for a fair comparison.
Designing health model evaluations
The result here is not an argument for choosing rubrics over preference, or preference over rubrics. It shows how much more we can learn when those measurements are designed together.
This is the kind of evaluation design we build at Centaur. We work with health model teams to define the qualities that matter for a specific use case, turn them into concrete rubrics, run evaluations with qualified clinical reviewers, and analyze how those dimensions relate to preference, accuracy, safety, and model behavior.
For a team evaluating a health model, that can start with something as simple as an existing set of responses and an early rubric. From there, we can build a repeatable evaluation around the questions the team actually needs to answer.