Overview
Can AI look at a photo of your food and tell you how many calories are in it? It's a surprisingly hard problem; a single photo can't show you portion size, how dense the ingredients are, or exactly how something was cooked, all of which change the calorie count. This benchmark tests something practical: can today's best AI models make a good guess anyway, using just visual cues and common sense?
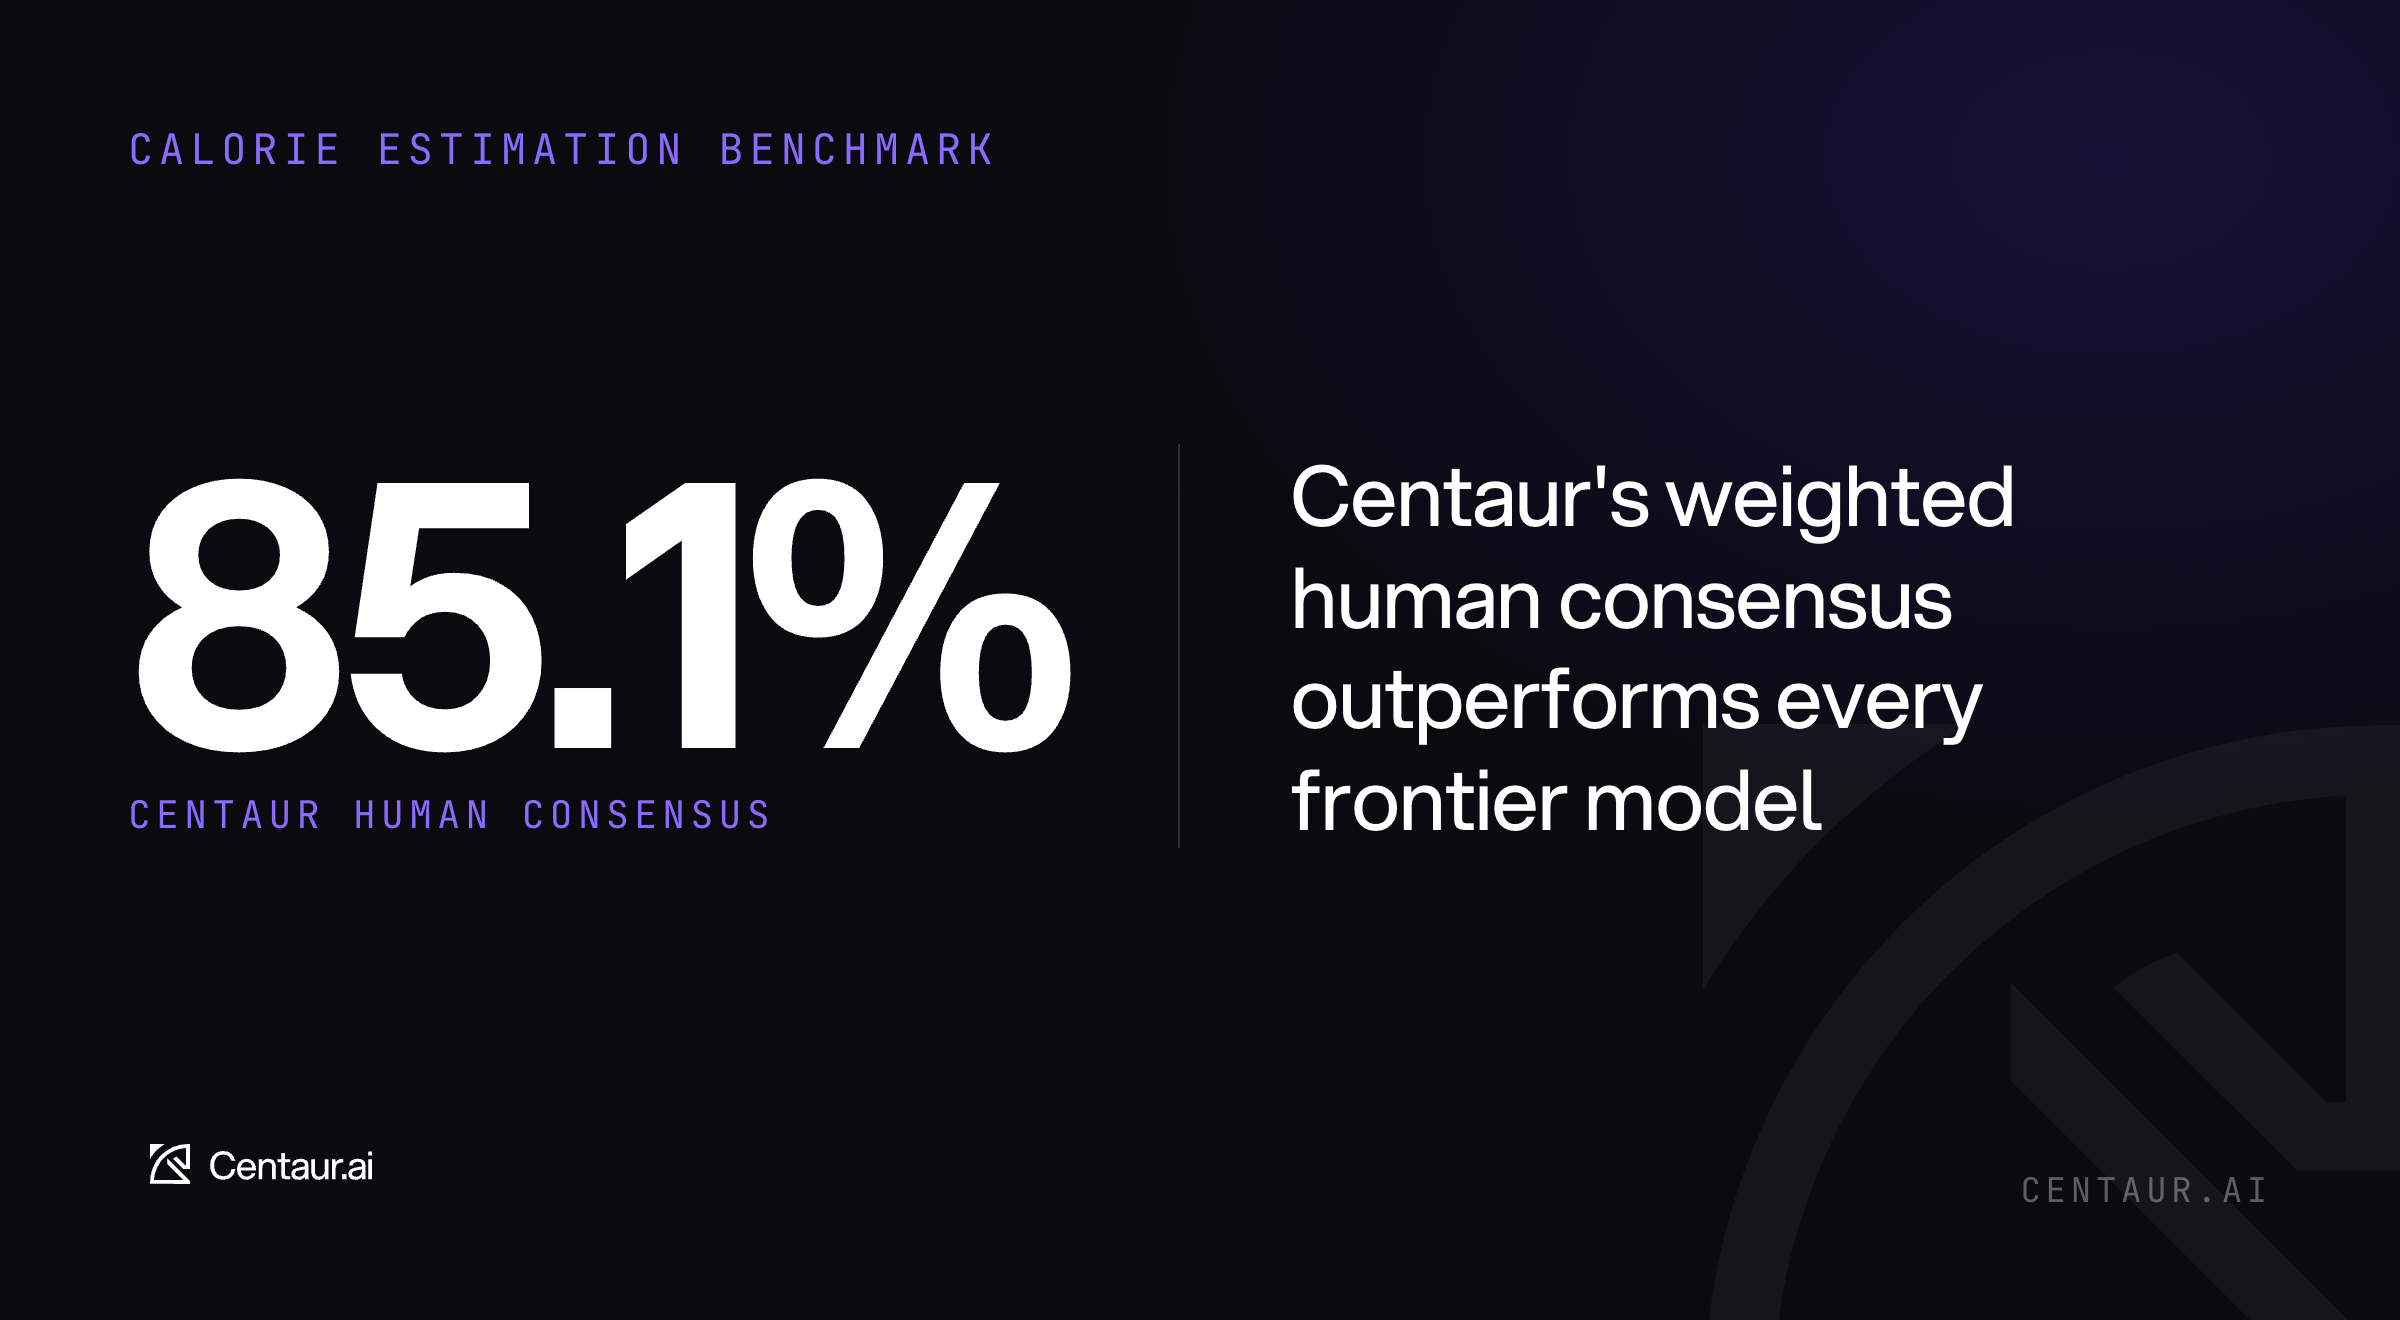
TL;DR: Centaur's human consensus hit ~85% accuracy on a proof-of-concept calorie assessment task, beating the best frontier model by over 10 points and the worst by 25 points. This matters for two reasons: people constantly lean on these models for similar tasks, and Centaur is well-positioned to close that accuracy gap. We achieved this with a semi-expert on-demand crowd and a consensus-focused algorithm that weighs each person's answer against their track record of accuracy on this specific task. We know, at any given moment, who is a reliable annotator on this task and who isn't -- and that distinction is what makes our consensus work. If our generalists and semi-experts can hit this bar, the next step is layering in our dietitian and nutritionist network for even higher accuracy and finer task granularity. [Read on for how we ran this and what it means for eval design.]
Results
We evaluated eight frontier vision models and Centaur's qscore-weighted human consensus on 3,490 food images with validated, objectively measured calorie metadata from Google Research’s Nutrition5k dataset.
The result: Centaur human consensus outperformed the models by 10-25pp. Centaur reached 85.1% accuracy, whereas Gemini 3.1 Pro, the highest-scoring model in this evaluation, reached 74.6% and Llama 4 Maverick, the lowest-scoring model, reached 60.8%. The remaining figures examine the gap between the models through class-level recall, confidence, prediction distribution, confusion matrices, error distance, and class-selection bias.
This sequence matters because overall accuracy only records how often a model is correct, while the later views describe where the errors concentrate and how they differ across model generations and families.
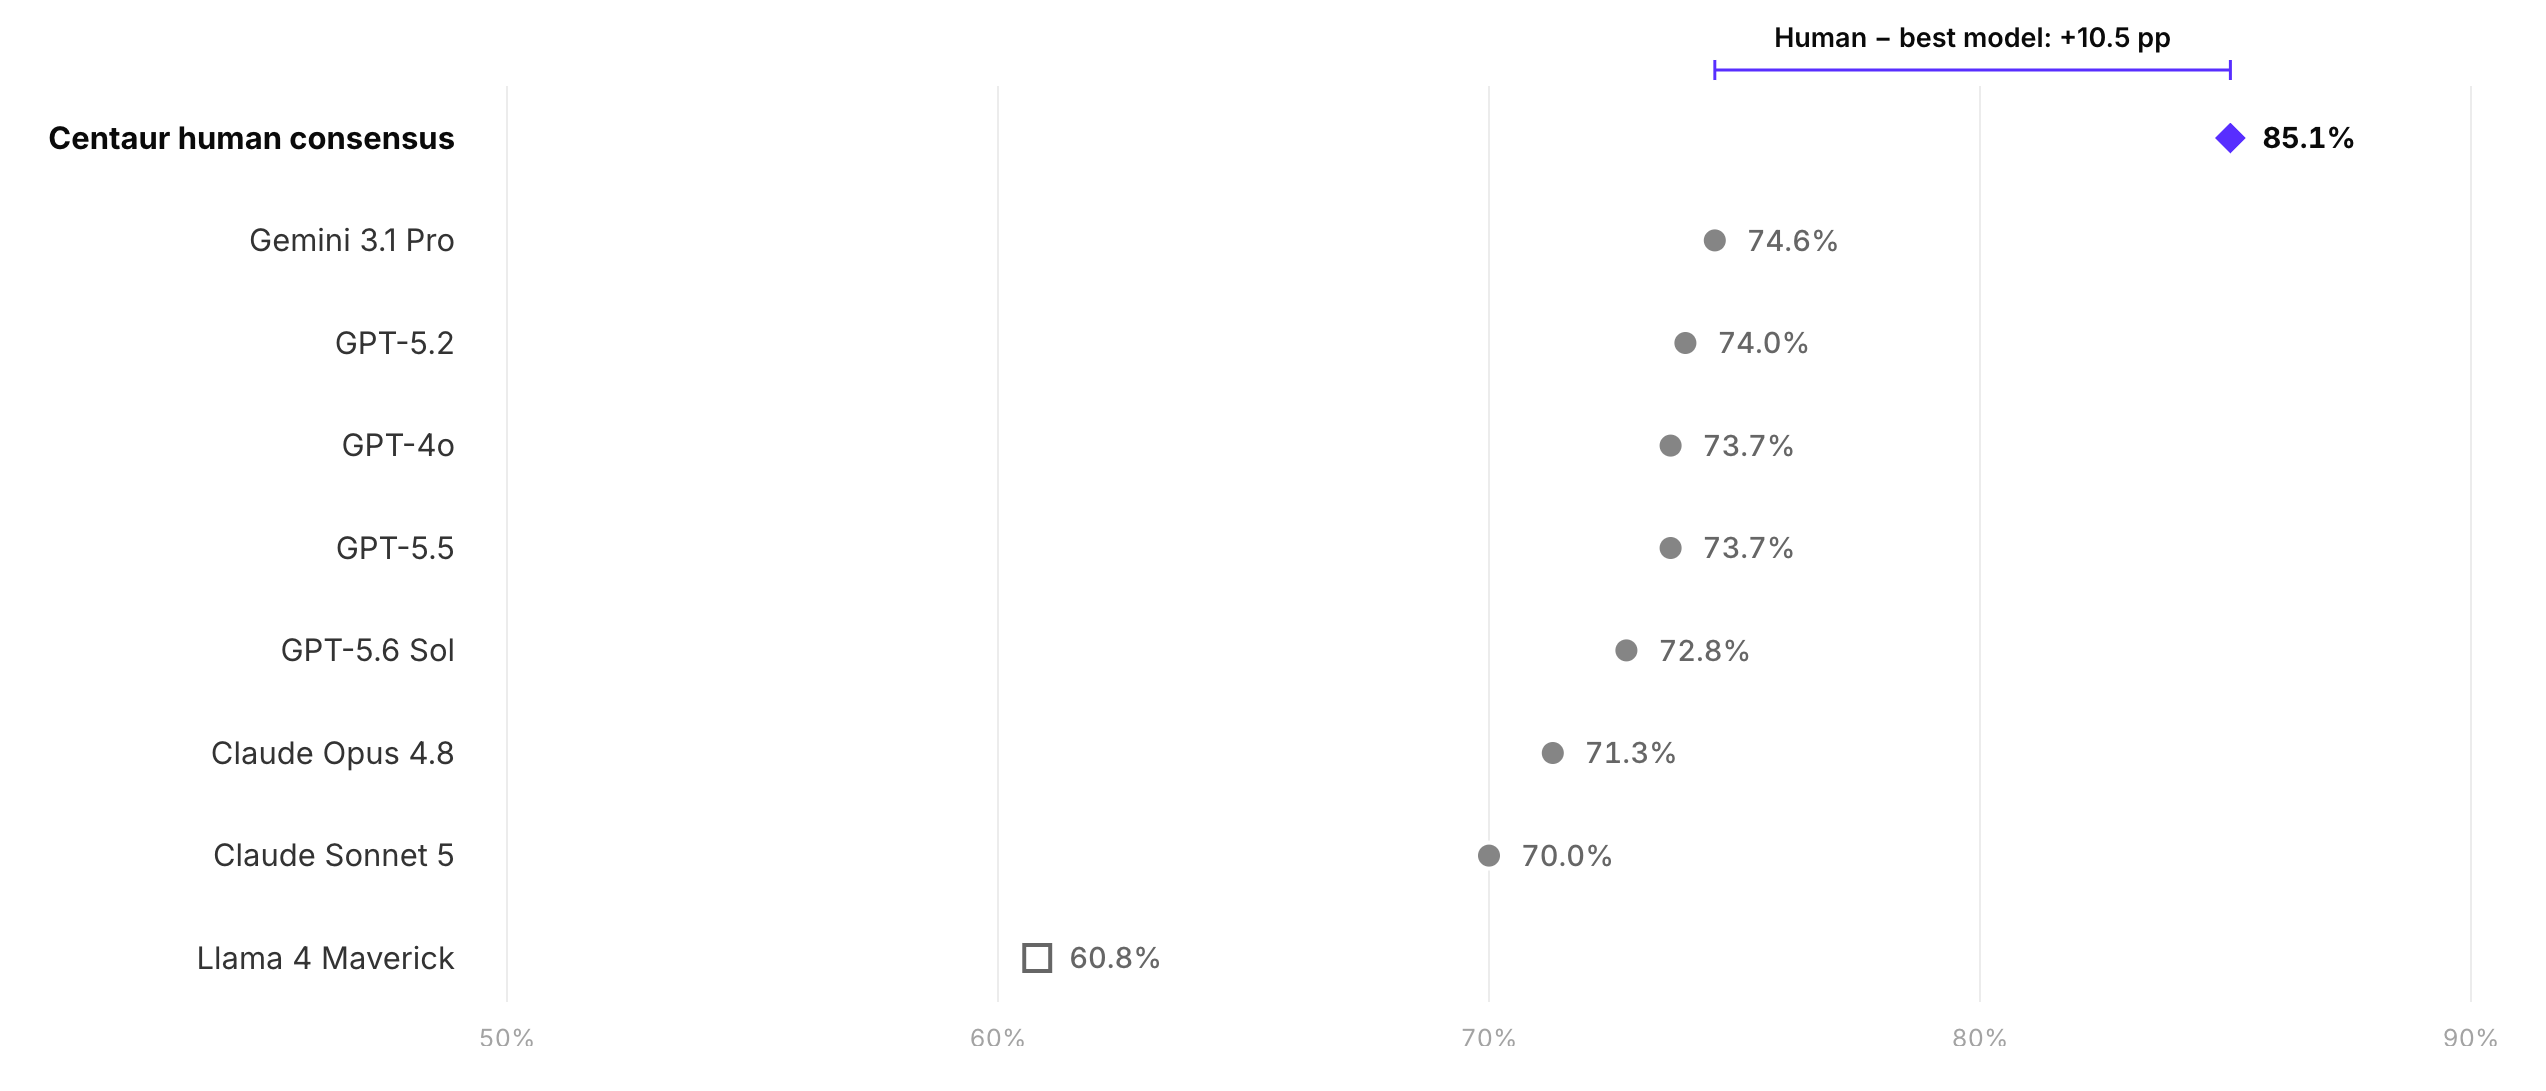
Figure 1 places the aggregate results on one scale. The seven closed models occupy a 4.6-point band, from 70.0% to 74.6%. Each estimate has an approximate 95% confidence interval of ±1.5 percentage points, so small rank differences inside that group warrant caution.
The comparison with human consensus is more pronounced, human consensus finished 10.5 points above Gemini 3.1 Pro and at least 10 points above each closed model tested. Llama 4 Maverick, the open-weights comparator, scored 60.8%.
The four July additions scored between 70.0% and 72.8%, leaving the human-to-model gap intact. These benchmark results support a narrow conclusion: the latest releases did not reduce the gap on this calorie-estimation task. They do not establish a broader ranking of the models' vision capabilities.
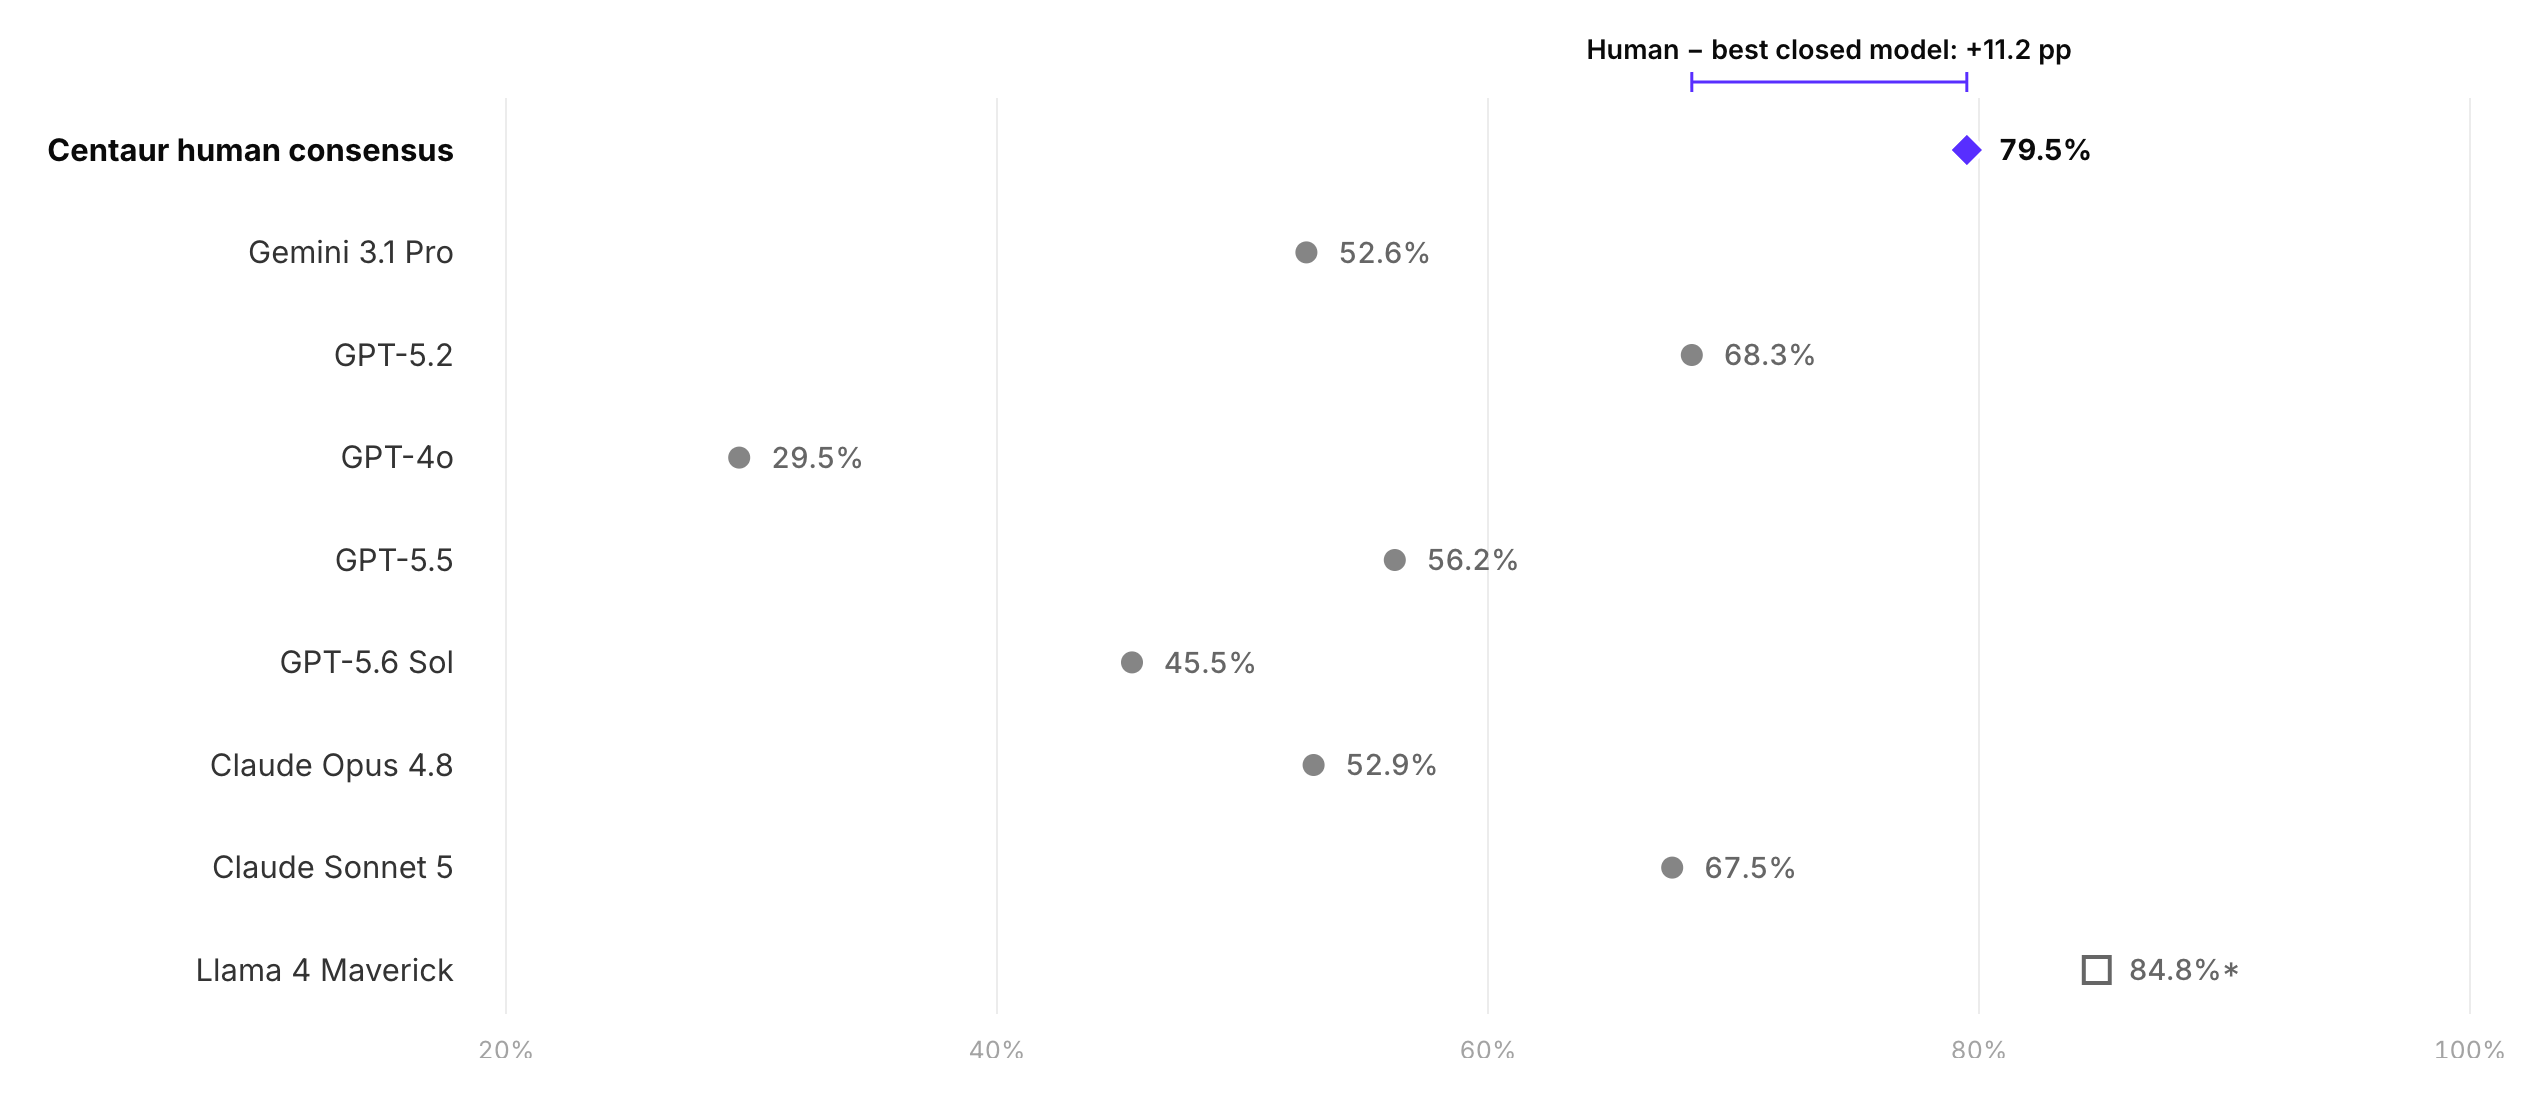
Figure 2 narrows the analysis to the 882 images in the 150-300 calorie category. Human consensus correctly classified 79.5% of these images. Recall among the seven closed models ranged from 29.5% for GPT-4o to 68.3% for GPT-5.2.
Several models performed well at the ends of the scale and lost accuracy in the middle. GPT-4o reached 87.6% recall on low-calorie images and 89.8% on high-calorie images, compared with 29.5% in the middle. GPT-5.6 Sol reached 92.0% recall on high-calorie images and 45.5% on mid-range images.
Meals near 150 or 300 calories can resemble examples on either side, and a single image leaves portion mass and ingredient density uncertain. This boundary problem appears across vendors and model generations.

We compared each model's mean selected-answer confidence on correct and incorrect predictions for the 882 mid-range images. All eight models reported higher mean confidence on their incorrect predictions.
The difference ranged from 4.1 percentage points for Gemini 3.1 Pro to 14.1 points for Claude Opus 4.8. GPT-4o averaged 88.4% confidence on incorrect predictions and 80.3% on correct predictions. GPT-5.2 averaged 68.8% and 59.6%, respectively.
These conditional means do not constitute a calibration curve or selective-risk analysis. They provide a narrower result: raw confidence, used alone, would rank many incorrect mid-range predictions as suitable for automatic handling. Teams considering confidence-based review thresholds should test those thresholds on the target distribution.
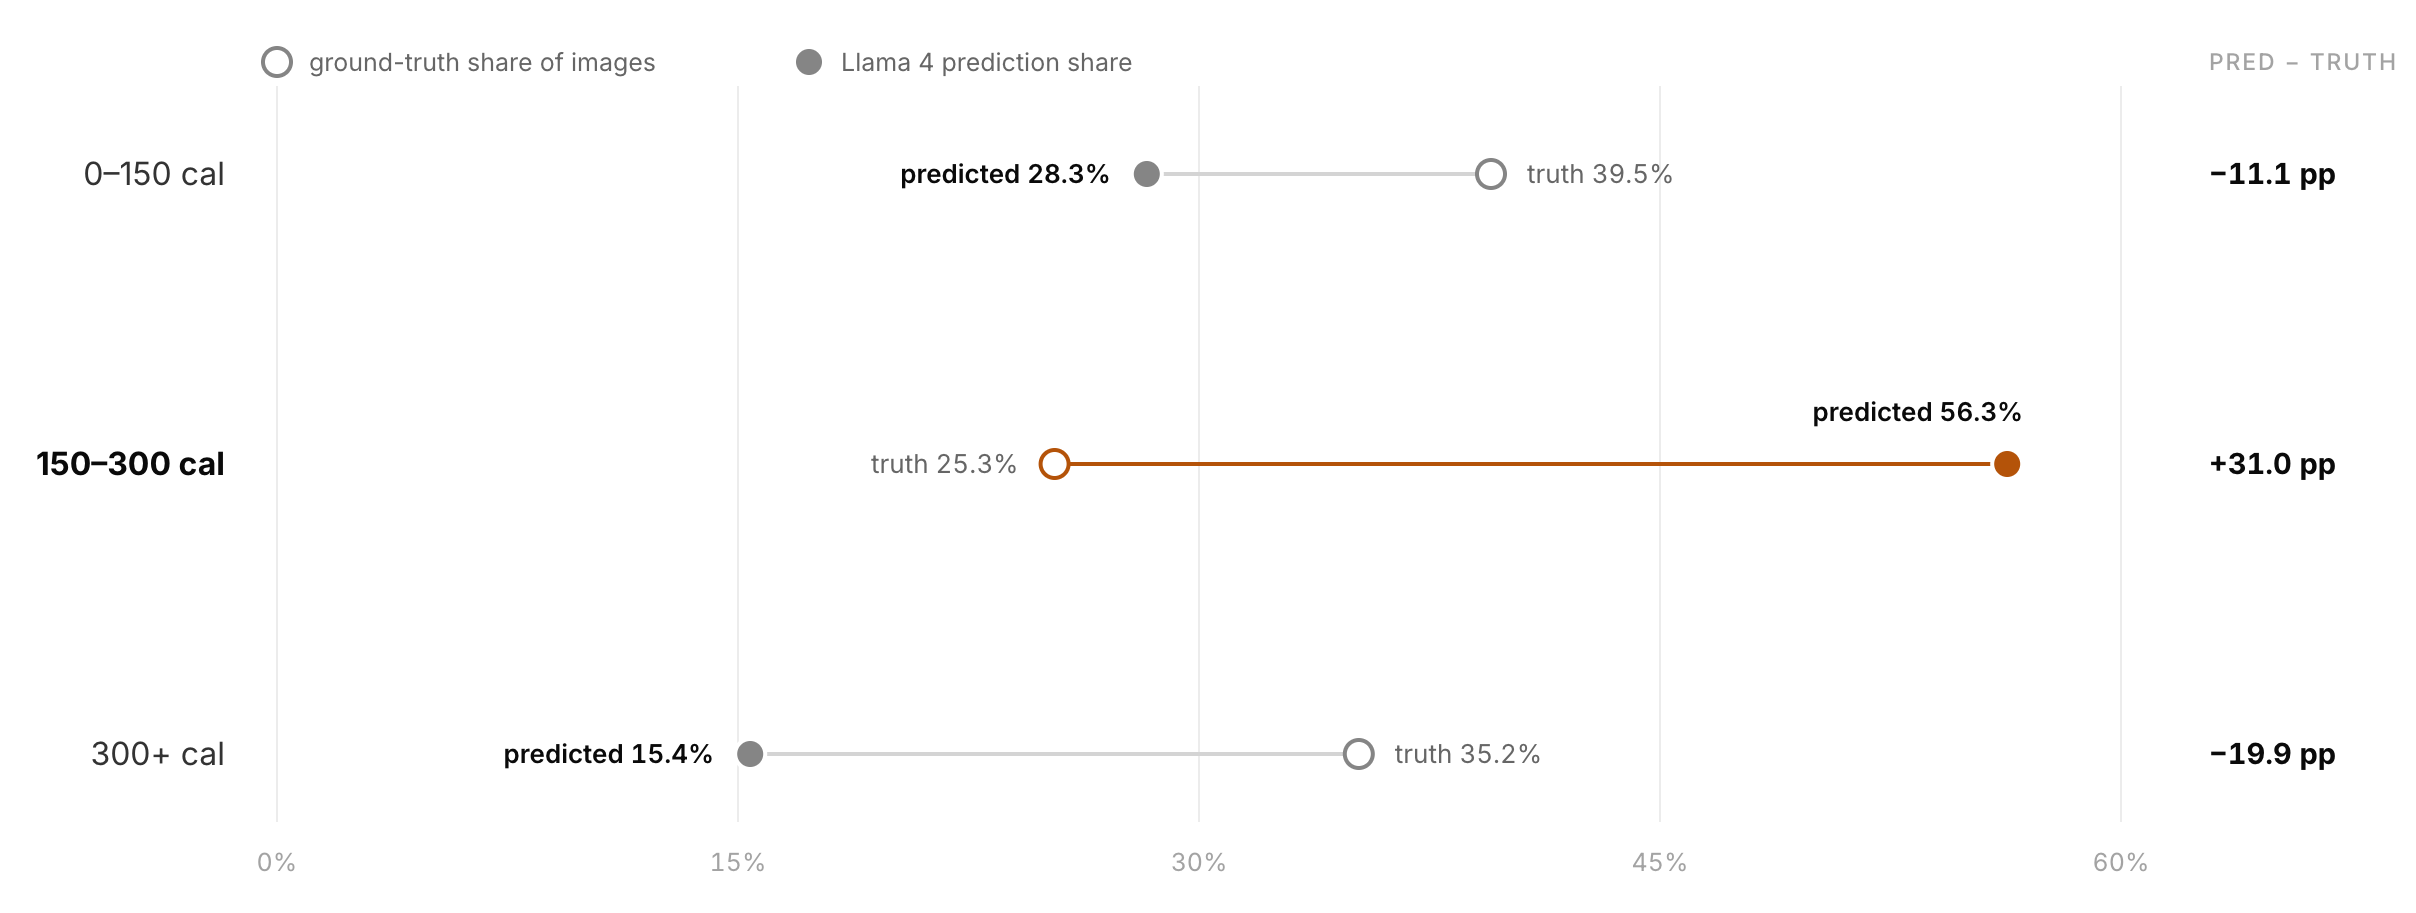
Figure 4 provides context for Llama 4 Maverick's 84.8% recall on the middle category. Llama predicts that category for 56.3% of the full dataset, although it accounts for 25.3% of the reference labels.
This prediction pattern captures many of the actual middle-category images. It also pulls 463 low-calorie images and 754 high-calorie images into the middle. The model's high middle-category recall therefore comes with substantial overprediction and 60.8% accuracy overall.
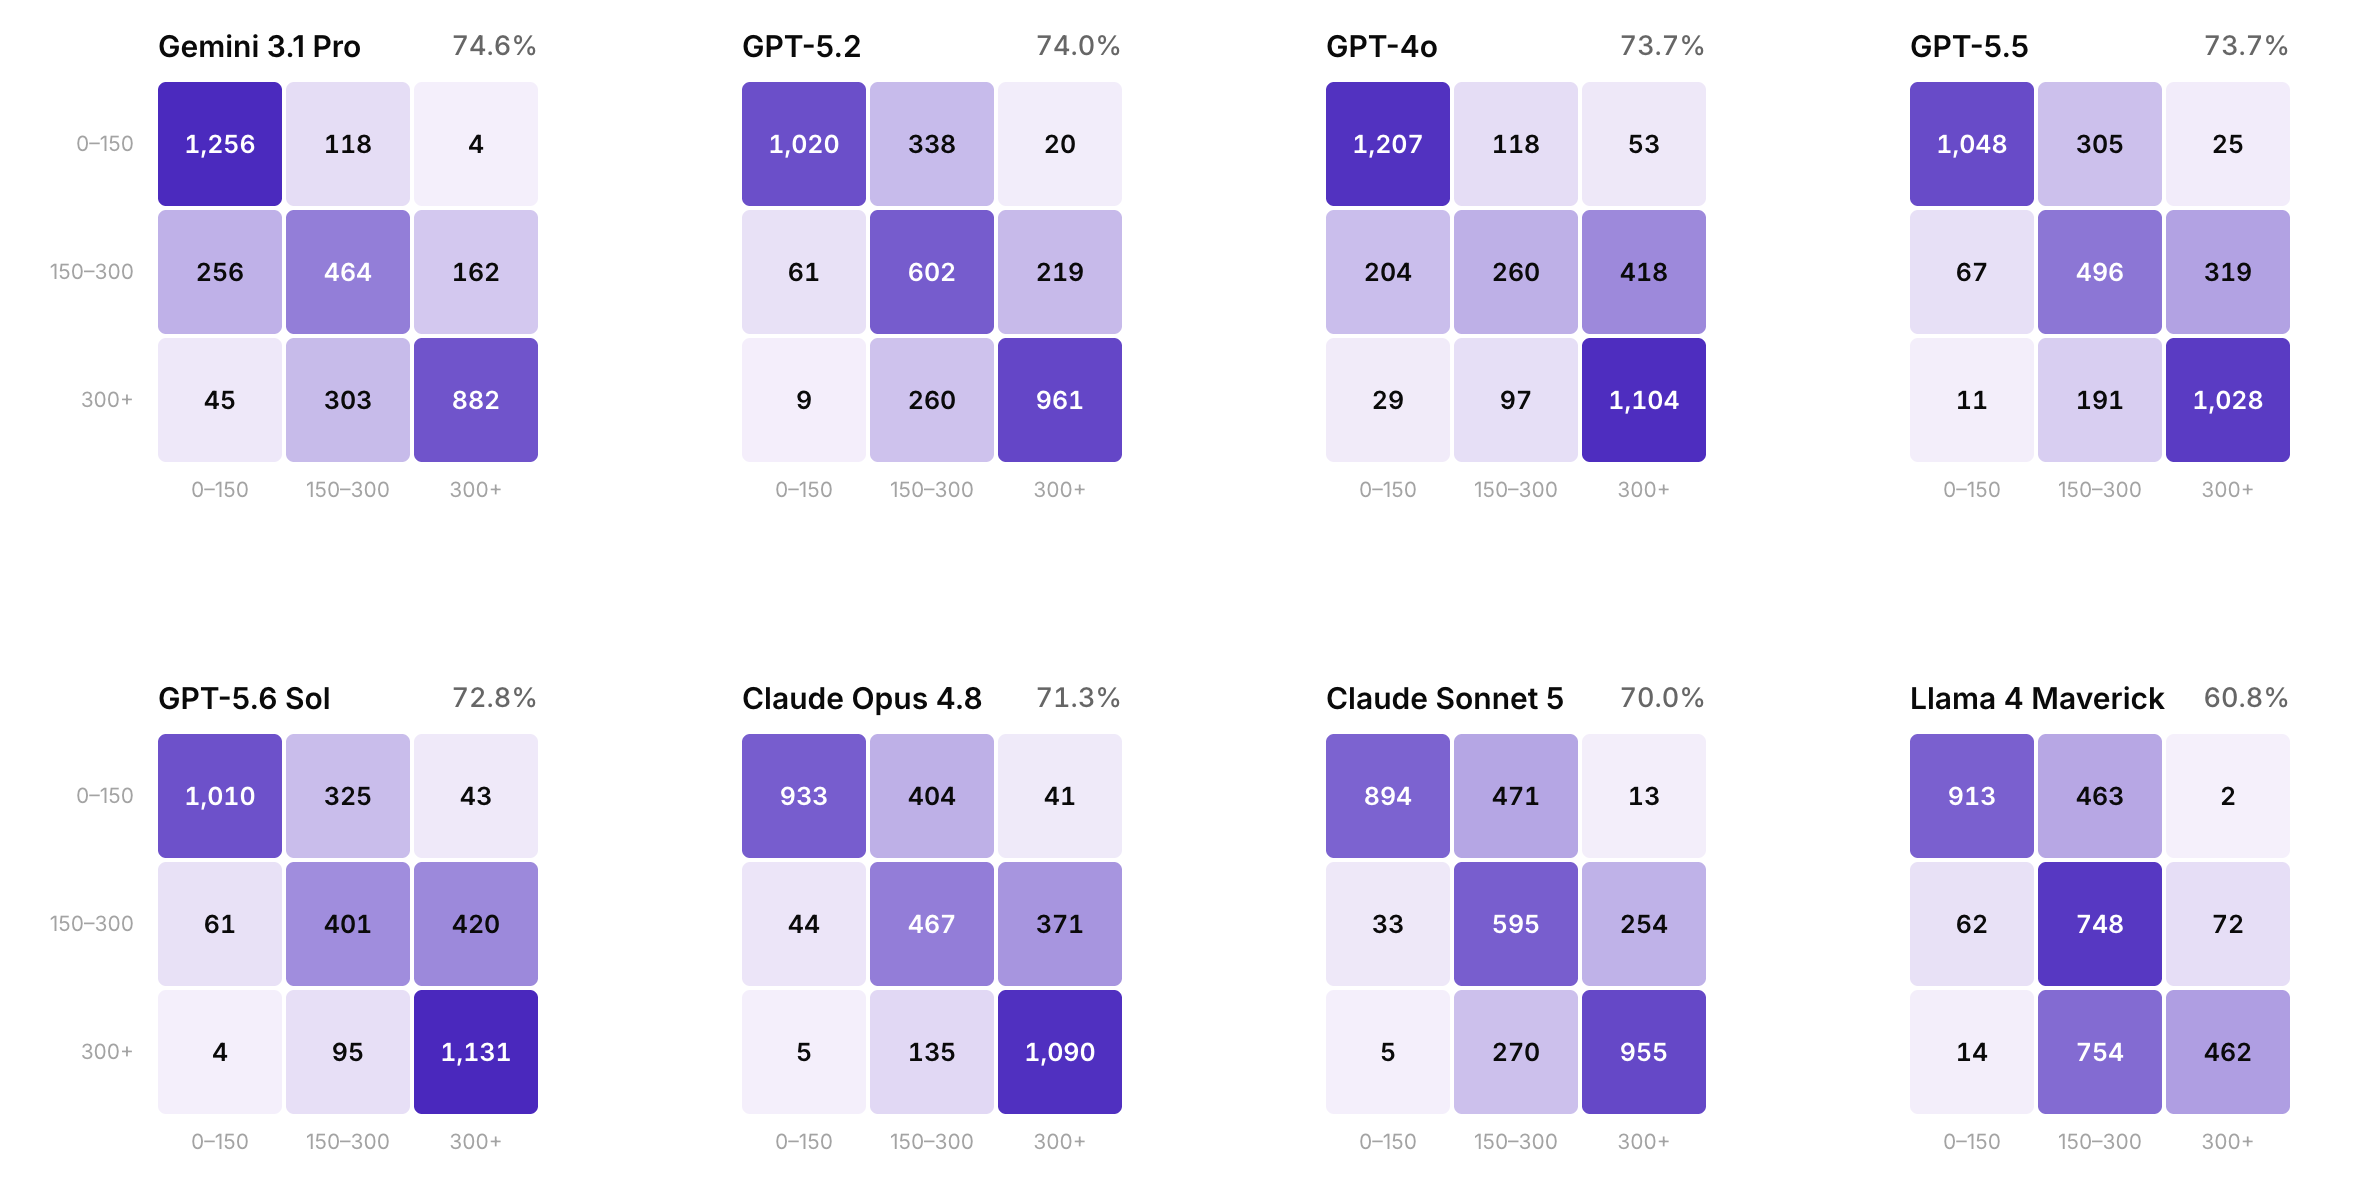
Figure 5 shows where each model's 3,490 predictions land. Several closed models have similar overall scores and distinct confusion matrices.
GPT-4o has a strong pull toward the high-calorie category. It assigns 418 of the 882 mid-range images to more than 300 calories and correctly classifies 260. GPT-5.6 Sol shows a similar profile, moving 420 mid-range images into the high category.
Sonnet 5 assigns 471 low-calorie images to the middle category. Llama 4 Maverick shows a broader middle-category preference, assigning 754 of 1,230 high-calorie images to the middle.
Teams diagnosing these models would pursue different improvements, GPT-4o needs better separation between the middle and high categories while Llama needs less reliance on the middle category across the dataset.
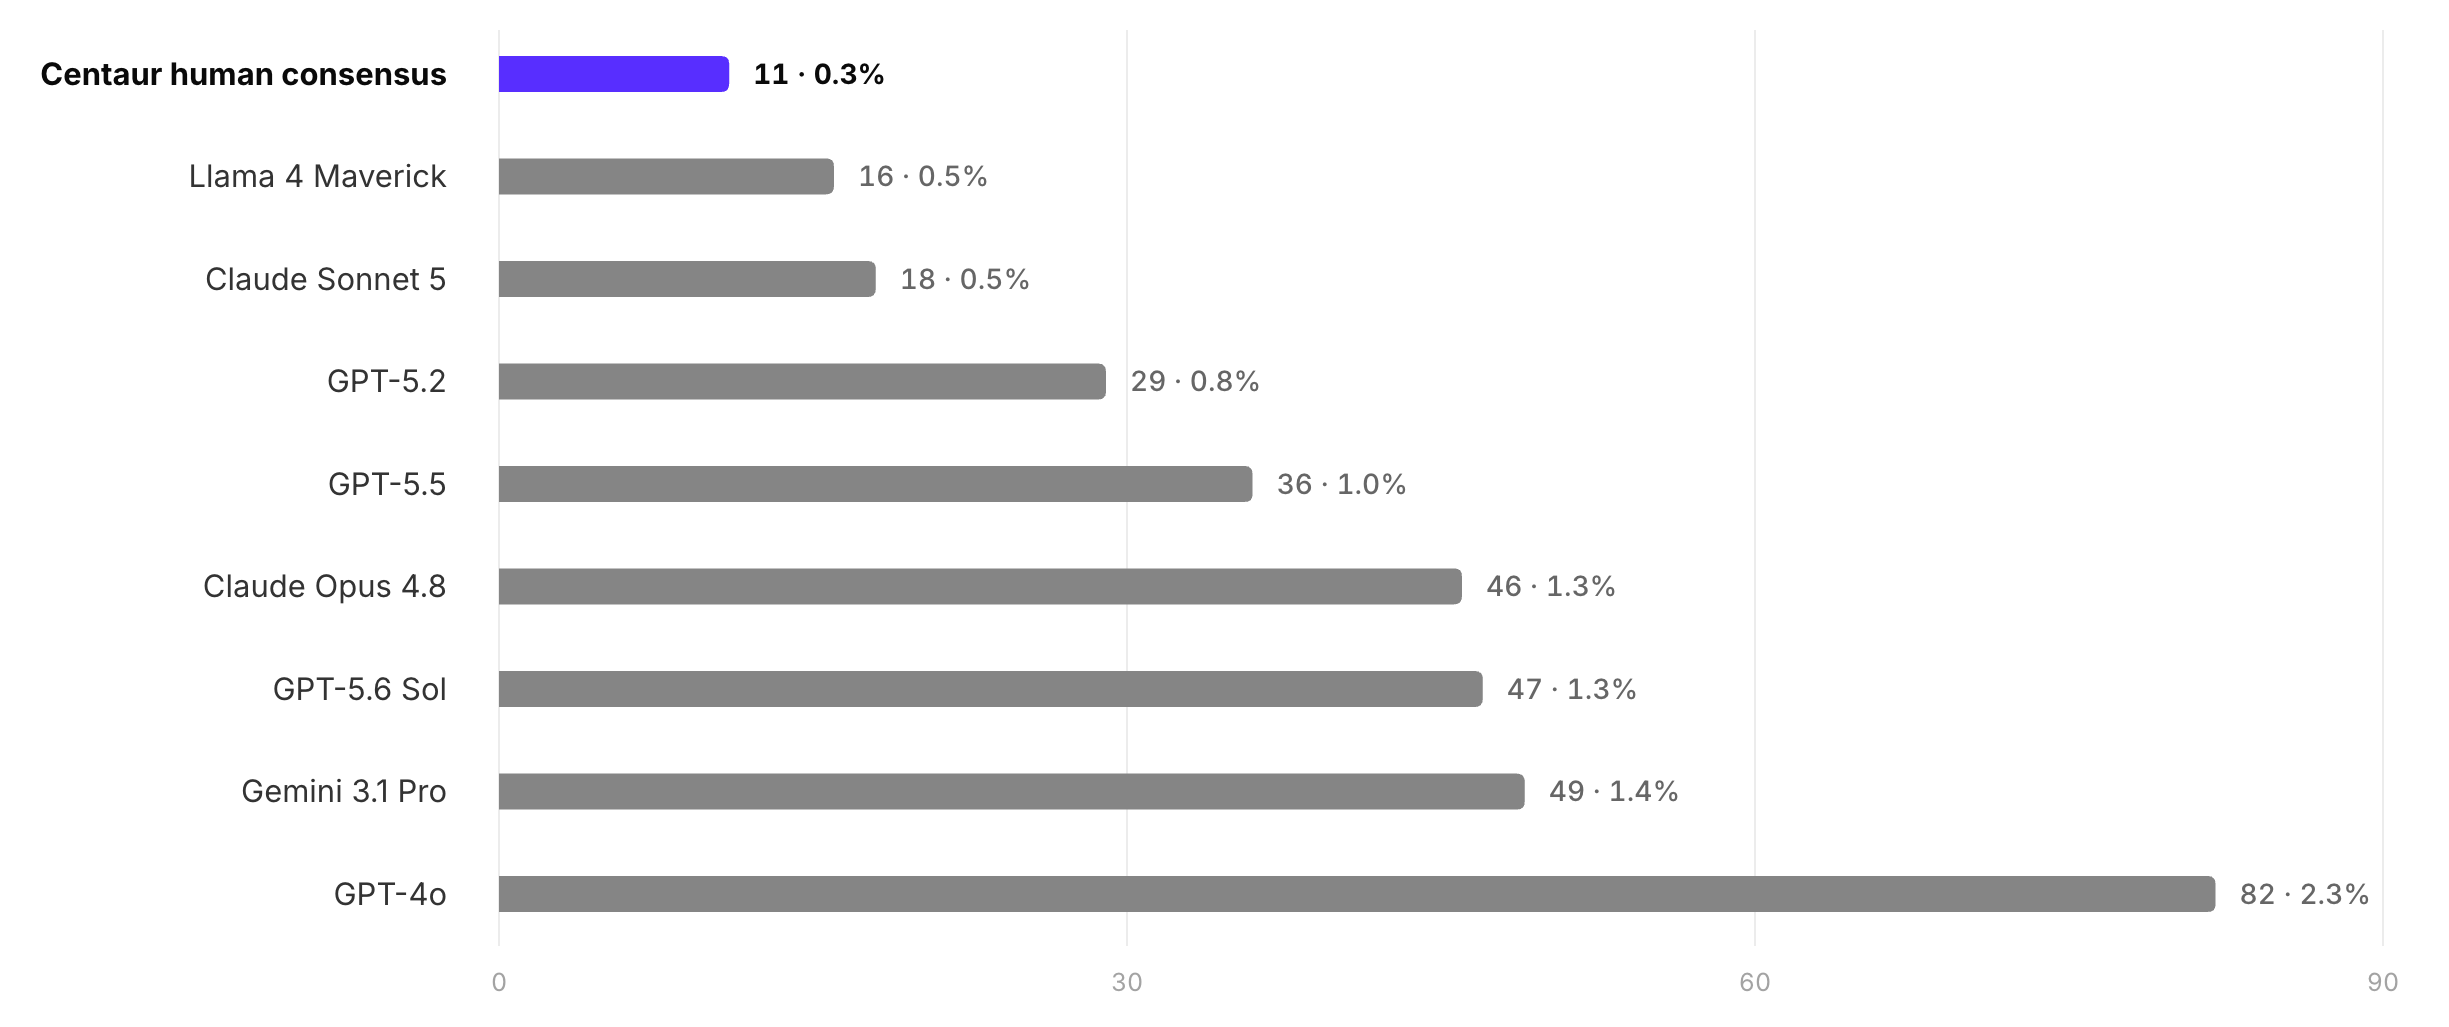
If the measured category is 0-150 calories, a prediction of 150-300 is one bucket away. A prediction above 300 is two buckets away. Accuracy marks both predictions incorrect while error distance records their different positions on the scale.
Human consensus produced 2,970 exact matches, 509 one-bucket errors, and 11 two-bucket errors. The models produced between 16 and 82 two-bucket errors. GPT-4o recorded the largest count, assigning 53 low-calorie images to the high category and 29 high-calorie images to the low category.
On this dataset, qualified human consensus achieves higher accuracy, maintains a class distribution closer to the reference distribution, and produces fewer two-bucket errors. The largest model weakness appears in the 150–300 calorie category, where model confidence also provides a poor review signal.
Methodology and interpretation notes
We used 3,490 food images from Google Research’s Nutrition5k dataset and assigned ground-truth buckets from measured calorie content. Throughout this report, “human consensus,” “Centaur human consensus,” and “Centaur consensus” refer to the qscore-weighted majority of qualified human expert reads; model reads are excluded. We kept the prompt and instructions constant across systems.
We ran all models except Llama 4 Maverick through our production AI-opinions pipeline. We ran Llama through AWS Bedrock with a replay harness using the same prompt, instruction slides, and images. We froze each model's outputs on its run date. On July 15, 2026, we recomputed human consensus with the qscore-weighted methodology from the May edition; additional qualified opinions moved accuracy from 84.8% to 85.1%.
This evaluation did not include dietitians or nutritionists.